An important theme of this years Economic Survey is the use of new forms of data and information for tracking economic activity and development.
The Survey looks at the use of a new kind of data – geo-spatial data and cartographic techniques – to track, compare and represent longer term developments.
Advertisement
Geospatial maps not only lets users visualise the data, but also helps users to better understand trends, relationships and patterns. The use of maps is not entirely new and previous Economic Surveys have used them for years, but there is now a plethora of information from satellites, drones, mobile phones and other sources.
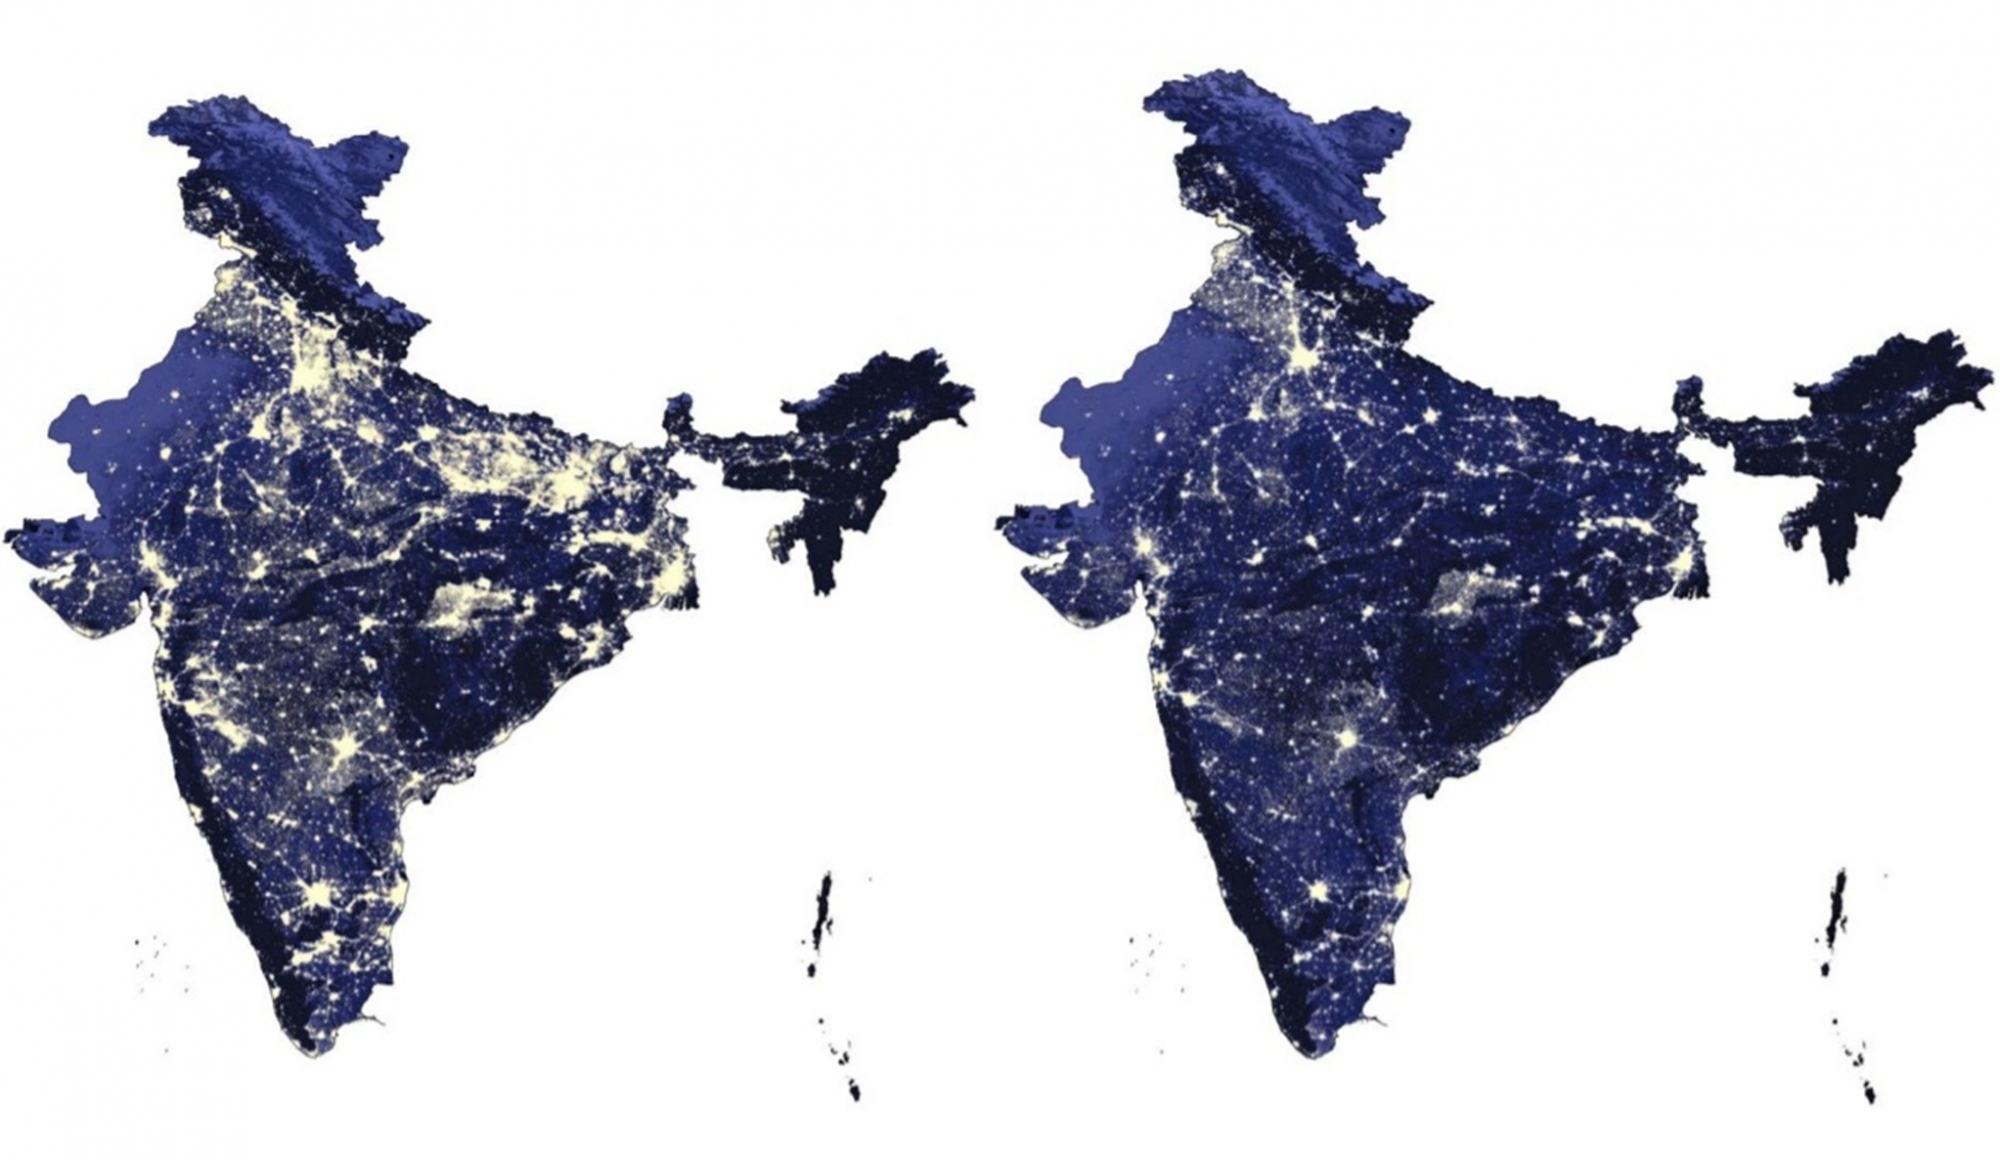
Using satellite images, India’s night-time luminosity is compared between 2012 and 2021. Night-time luminosity provides an interesting representation of the expansion of electricity supply, the geographical distribution of population and economic activity, urban expansion as well as growth of ribbon developments between urban hubs.
Similarly, using geospatial and cartographic techniques, the subsequent maps show the extent of physical as well as financial infrastructure development in India.
This includes expansion of national highways, airports, commercial bank branches, metros, etc. The maps depict change in net sown area of India over the last 15 years. The maps have been created by combining satellite data over the course of a 12-month period in each year.
The images compare the Kharif crop cycle in Moga district, Punjab, during 2005 and 2021. The images show that Kharif sowing cycle has shifted ahead by around two-to-three weeks causing the Kharif harvest to almost coincide with Rabi sowing in November.
The closing of the gap is a likely factor that encourages farmers to burn stubble and may be related to restrictions on early transplanting of Kharif paddy. These restrictions were introduced in 2009 in order to reduce pumping of ground-water, but may have had the unintended consequence of damaging air quality.
Satellite imagery is used to show annual water storage cycle at Stanley Reservoir, Tamil Nadu.
Using new geo-spatial methods, population density of select Indian cities is compared over time, showing the extent of urban expansion in Delhi-NCR and Bengaluru between 2001 and 2021. Using satellite imagery, illustrations are given for wasteland redeployment in Andhra Pradesh and Gujarat.