‘One swallow does not make a spring nor does one fine day,” is attributed to Aristotle, fourth century BCE. A more recent English version is, “one swallow makes not a summer, nor one woodcock a winter”. Both are adages to warn us against reliance on insufficient data. And so does the fable by Aesop, when it speaks of the man who sold his coat when he saw the first swallow and thought the winter was over.
In the modern world, the reliability of data used for quality control, market forecast and for proving the effect of drugs has grown in importance. With automation of data collection and the power of computers, statistical analysis has become a routine activity and high levels of safety and economy have become possible. And so has competitiveness. But competition has pushed some researchers and the world of commerce to tweak the numbers and use statistics to make claims that are not justified.
Advertisement
The journal, Nature, carried an article about the work on statistics by Dr John Carlisle, an anesthetist working in the general hospital of the seaside town of Torquay, South-west England.
Dr Carlisle dabbles in statistical analysis and he uses his skills to look for features which help question the figures submitted by researchers as statistical support for their findings. The objective of statistical analysis is to identify a “central tendency” of a collection of measurements, when exact measurement or calculation is not feasible. When things are measured in this way, it is of value to know how reliable this estimate of most likely measurement is, to stand in place of the correct value. Although no one measurement may be exactly the correct value, it is found that a collection of measurements crowd around the exact value, with measurements that are further from the correct value being less frequent.
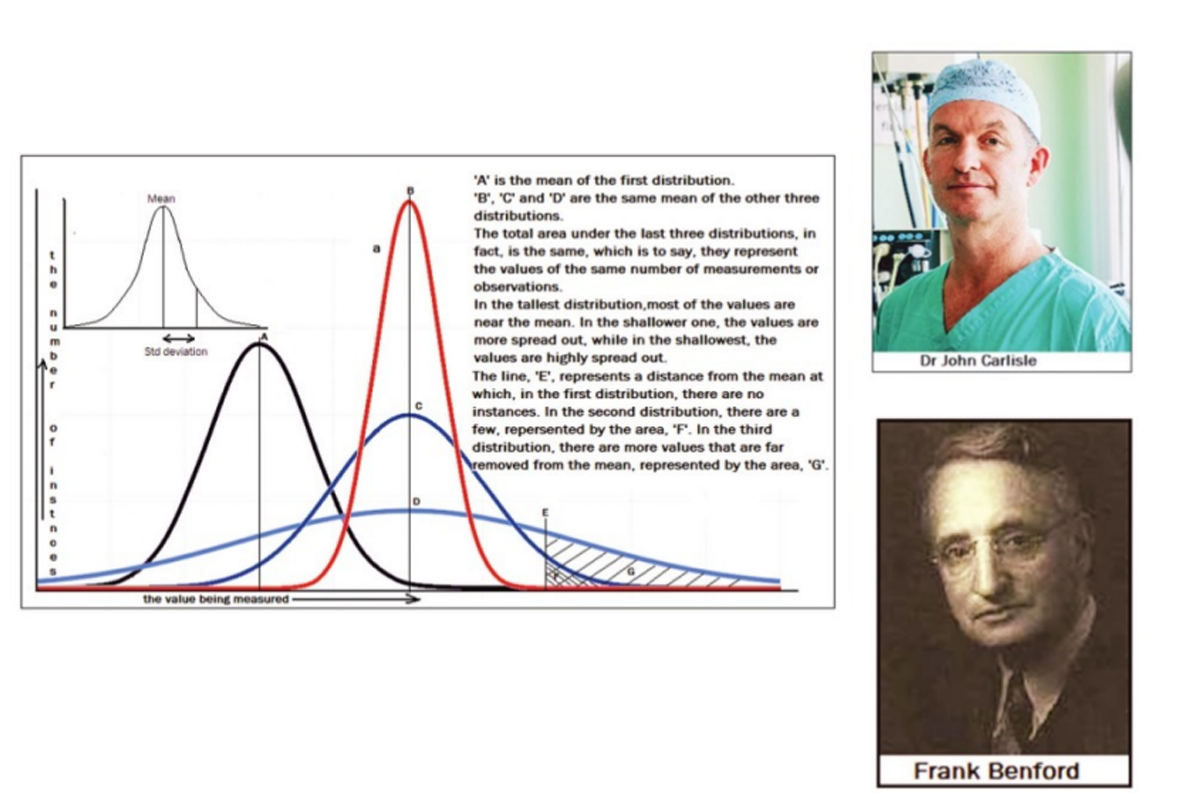
A representation of the number of instances at the different values is found to have the bell shape, shown in the diagram above. The central value, which is taken as correct, is known as the “mean” of the distribution. When a large number of measurements are made, the “bell shape” of the distribution, which reflects the relative frequency of deviation from the mean, becomes smoother, and the “mean” is more reliable.
The set of three bell shaped curves, on the right side of the diagram show three levels of “spread” or the uncertainty of a measurement being close to the correct value. A measure of the spread of the data is a value called the Standard Deviation. This is the range, on the two sides of the mean, within which just over 68 per cent of the data falls. We can see that a low value of the SD indicates data that is close to the mean, while a large SD indicates data that is more spread out.
The “bell shaped” distribution and the SD, depend on the nature of the data and given a number of measurements that have been made, one set of measurements generally shows the same level of spread as another set of measurements. In fact, just as things like the SD help assess how good the mean of a set of random measurements has turned out to be, features of the measurements made also help to assess how truly random, or unbiased, the process of measurement has been.
This reverse process is what Dr Carlisle has been doing, with the data that has been published by researchers and pharmaceutical firms. Statistics are an important tool in the hands of researchers, both of basic physical principles as well as of the effectiveness of drugs or the extent of their side effects.
Thus, where a random process should result in a certain distribution of measurements, researchers alter one or more conditions in the trial and see how the behaviour of the values has been affected. And there are ways of establishing whether any change in the behaviour is one caused only by chance or as a result of the changed factors. In the case of a test of a drug, the value measured could be the incidence or severity of disease and the factor that is varied could be the dosage of the drug administered.
But it may happen that a researcher wishes to show some result that the statistics do not really prove to shore up the effectiveness of a drug for a drug manufacturer. In these cases, the researchers are known to “doctor” the results of measurements, so that they show a shift in the mean or a change, which seems to be better than what could have come about by chance. This kind of dishonest reporting could set ongoing research on an incorrect path or, in the case of drugs, lead to wrong use or dosage, with serious consequences.
As an anesthetist, Dr Carlisle, and others, became concerned about the findings of one researcher, of the effectiveness of drugs to prevent nausea in patients recovering from surgery. When Dr Carlisle checked the data, he found that there were features in the “spread”, which were not what should be seen in trials that were conducted, in the correct, scientific manner, at random. The measurements were apparently selected in a way that they would support the conclusion that the researcher wished to prove. The University where the researcher worked was alerted, as also the journals that had carried his publications, and after investigation, as many as 183 papers by this researcher were found to be concocted, and were withdrawn.
The article on Dr Carlisle says the work he does, of analysing papers published the world over, has been steadily uncovering fraud after fraud in research. Although there have been instances where suspicions have been raised where they should not have been, Dr Carlisle’s work, “together with the work of other researchers who doggedly check academic papers, suggests that the gatekeepers of science — journals and institutions — could be doing much more to spot mistakes,” the article says.