A Task Force under the chairmanship of Y K Alagh was formed by the Planning Commission in 1979. The committee estimated the average calorie requirements and derived PL corresponding to such requirements for both rural and urban areas.
The estimated calorie norm was 2400 calories per capita per day in rural areas and 2100 calories per capita per day in urban areas. Poverty estimates for subsequent years were to be calculated by adjusting the price level for inflation. But a mere calorie approach was criticised as it failed to capture the complexity of poverty and deprivation.
Advertisement
However, the Planning Commission appointed an Expert Group in 1989 under the chairmanship of D T Lakdawala. The committee submitted its report in 1993. The Lakdawala committee retained the PL defined by the Task Force (Alagh) which was at national level in rural and urban areas and made some suggestions:
(1) consumption expenditure should be calculated based on calorie consumption as earlier; (2) state specific PLs should be constructed and these should be updated for subsequent years by using Consumer Price Index for Agricultural Labourers (CPIAL) for rural areas and Consumer Price Index for Industrial Workers (CPI-IW) for urban areas, and (iii) discontinuation of ‘scaling‘ of poverty estimates based on National Accounts Statistics.
This assumes that the basket of goods and services used to calculate CPI-IW and CPI-AL reflect the consumption patterns of the poor. The state-wise beneficiaries of the Targeted Public Distribution System (TPDS) were the BPL population calculated following the recommendations of Lakdawala Committee.
The Expert Group under the chairmanship of Suresh Tendulkar was constituted by the Planning Commission in December 2005 to review the methodology for poverty estimation and to address some shortcomings of the previous methods:
(1) consumption patterns were linked to the 1973-74 poverty line baskets (PLB) of goods and services, whereas there were significant changes in the consumption pattern of the poor since that time, which were not reflected in the poverty estimates, and (ii) there were issues with the adjustment of prices for inflation, both spatially (across regions) and temporarily (across time).
However, it recommended four major changes: (i) a shift from calorie consumption-based poverty estimation; (ii) a uniform poverty line basket (PLB) across rural and urban areas; (iii) a change in the price adjustment procedure to correct spatial and temporal issues with price adjustment, and (iv) incorporation of private expenditure on health and education while estimating poverty.
The Expert Group (Tendulkar) computed PL for 2004-05 at a level that was equivalent, in Purchasing Power Parity terms to Rs 27 for rural India and Rs 33 for urban India. Percentage of population below PL calculated by the Lakdawala Committee and the Tendulkar Committee for the year 2004-2005 appears. (see table above).
Another Expert Group under the chairmanship of Dr. C Rangarajan to review methodology for measurement of poverty in the country was constituted by the Planning Commission in June 2012. It took around two years to submit a report. The committee redefined the PL and advocated that the new PL should be Rs. 32 in rural areas and Rs. 47 in urban areas.
The expert group headed by Dr. Rangarajan dismissed the Suresh Tendulkar Committee methodology on estimating poverty, and estimated that the number of poor in India was much higher in 2011-12 at 29.5 per cent of the population. As per the Rangarajan panel’s estimates, three out of 10 in India would be poor. Estimates based on Tendulkar committee methodology had pegged the poverty ratio at 21.9 in 2011-12.
The latest Rangarajan report has added 93.7 million more to the list of the poor assessed in 2013 as per Suresh Tendulkar committee formula. (see table below).
Even though common perceptions of poverty consider income and consumption, there are significant and rational approaches which say that other factors must be included. This is because poverty is multidimensional. In the words of Amartya Sen: “In the income space, the relevant concept of poverty has to be inadequacy (for generating minimally acceptable capabilities), rather than lowness (undependably of personal characteristics).
A ‘poverty line’ that ignores individual characteristics altogether cannot do justice to our real concerns underlying poverty, viz. capability failure because of inadequate economic means.” More sophisticated measures of poverty go beyond income, consumption expenditures and calorific intake and take into consideration other things of value. Even when the poor typically describe their poverty, they do so in ways that go beyond simply not having enough money. Examples of such approaches include the Multidimensional Poverty Index (MPI) and the Human Development Index (HDI).
NITI Aayog’s MPI is an improvement on the earlier method of estimating poverty. MPI takes into account multiple elements of potential deprivation in terms of health, education and living standards estimates deprivation on each indicator and sees the overlap of deprivations to estimate multidimensional poverty.
According to the NITI Aayog, the first National MPI shows 25 per cent of Indian’s population are poor, a figure that is higher than income-based measures of poverty. The MPI cited by the NITI Aayog was constructed from data obtained fromthe NFHS-4 of 2015-16. The NITI Aayog’s MPI-21, still under construction, is based on 12 indicators covering such broad areas as education, health and the standard of living.
India has not counted the poor since 2011. But the United Nations estimated that number of the poor in the country to be around 364 million in 2019, or, 28 per cent of the population. In recent years, India emerged as the country with the highest rate of poverty reduction. The Covid pandemic has worsened India’s poverty crisis to such an extent that the world’s fastest poverty reducing country adds to the maximum poor in a year.
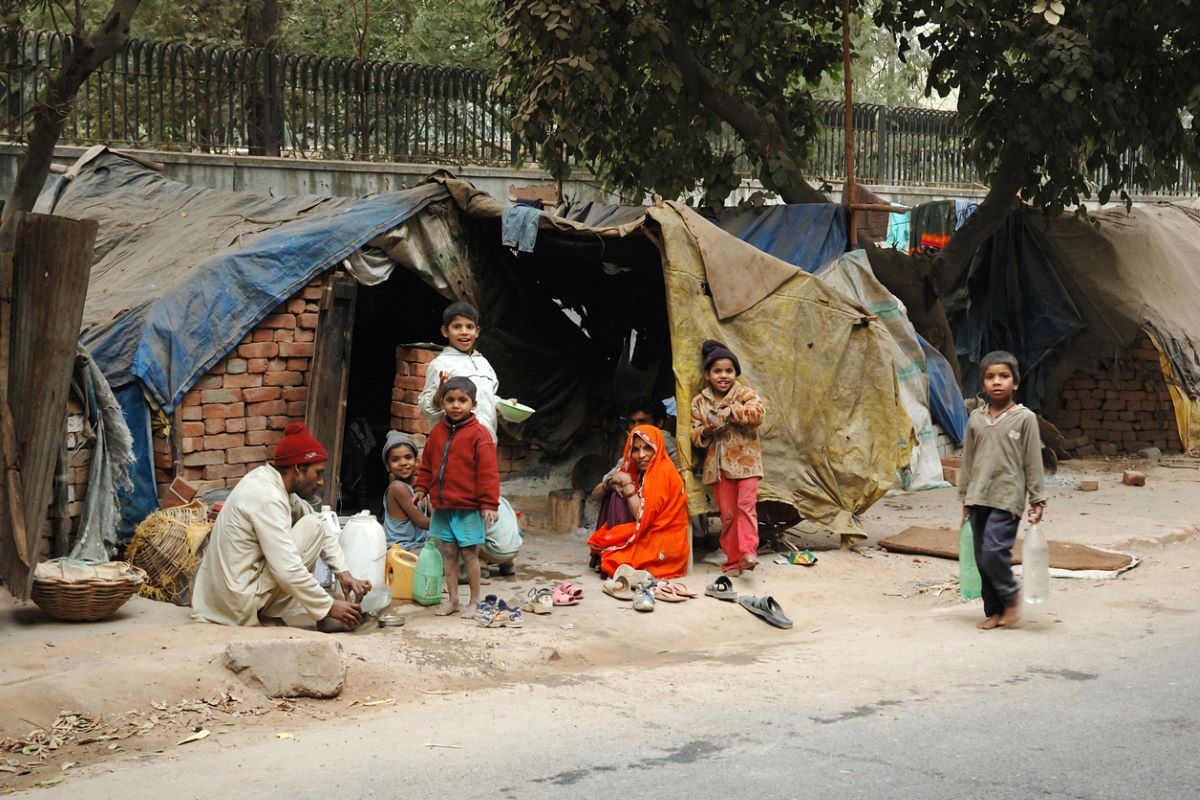
It is estimated that around 150-199 million additional people will fall into poverty this year. It means an overall increase in poverty by 15-20 per cent, making around half of the country’s population poor. Compared to urban areas, major escalation of poverty is witnessed in rural areas. Indeed, the stated poverty status corroborates what our former Prime Minister and an eminent economist, Manmohan Singh, once said: “India happens to be a rich country inhabited by very poor people”.
(The writer is a retired IAS officer)