NASA’s Jet Propulsion Lab lays off 8% of workforce citing lack of funds
About 40 additional members of contractor workforce have also been laid off.
A new NASA map resulting from 20 years of observing “life” on our home planet has discovered long-term changes across…
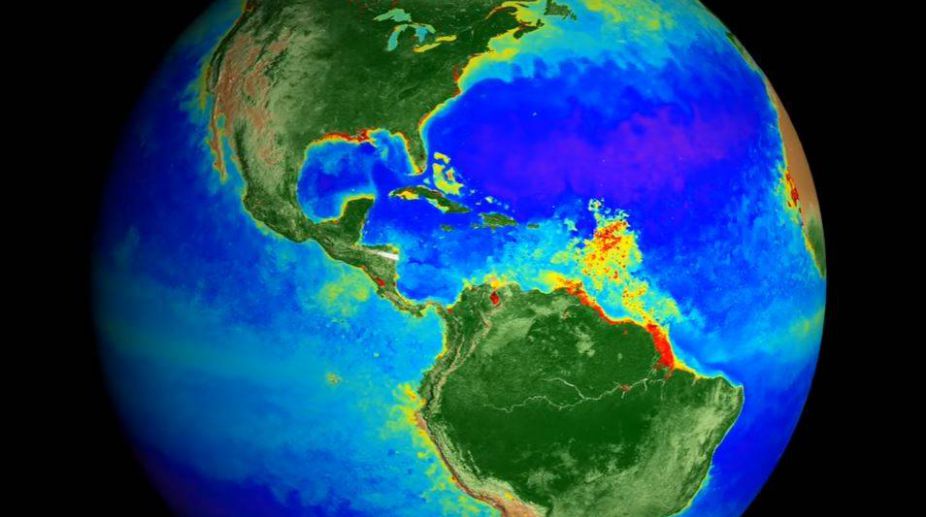
A new NASA map resulting from 20 years of observing “life” on our home planet has discovered long-term changes across continents and ocean basins.
The space-based view of life allows scientists to monitor crop, forest and fisheries health around the globe, NASA said.
Satellites measured land and ocean life from space as early as the 1970s. But it was not until the launch of the Sea-viewing Wide Field-of-view Sensor (SeaWiFS) in 1997 that the space agency began what is now a continuous, global view of both land and ocean life.
Advertisement
The data visualisation, released this week, captures how Earth was changing with the seasons.
“These are incredibly evocative visualisations of our living planet,” said Gene Carl Feldman, an oceanographer at NASA’s Goddard Space Flight Centre in Greenbelt, Maryland.
“That’s the Earth, that is it breathing every single day, changing with the seasons, responding to the Sun, to the changing winds, ocean currents and temperatures.”
As NASA begins its third decade of global ocean and land measurements, these discoveries point to important questions about how ecosystems will respond to a changing climate and broad-scale changes in human interaction with the land.
“Satellites have measured the Arctic getting greener, as shrubs expand their range and thrive in warmer temperatures.
“As ocean waters warm, satellites have detected a shift in phytoplankton populations across the planet’s five great ocean basins, the expansion of ‘biological deserts’ where little life thrives,” NASA said.
And as concentrations of carbon dioxide in the atmosphere continue to rise and warm the climate, NASA’s observations could also play a critical role in monitoring carbon as it moves through the Earth system.
Advertisement